It's not T20. Test batting fell because India turned its pitches into minefields.
The story everyone tells about Test cricket in 2025 goes like this: T20 ruined batting technique. Kids grew up slogging, the defensive game atrophied, and Test averages cratered. It's a clean story that's wrong.
I pulled every men's Test from 2003 to 2025 (~770 matches, 21,741 top-7 batter-innings, 5.6 million deliveries from my cricket mcp that is sourced from cricsheet) and ran the numbers. The popular explanation doesn't survive contact with the data. Neither does the boutique "Dukes ball" explanation that some commentators have started telling. The actual answer is more boring and more interesting at the same time: boards changed how they prepare pitches, and a generational bowling cohort showed up at exactly the wrong moment for batters. India is the cleanest natural experiment in the dataset, and they did it to themselves.
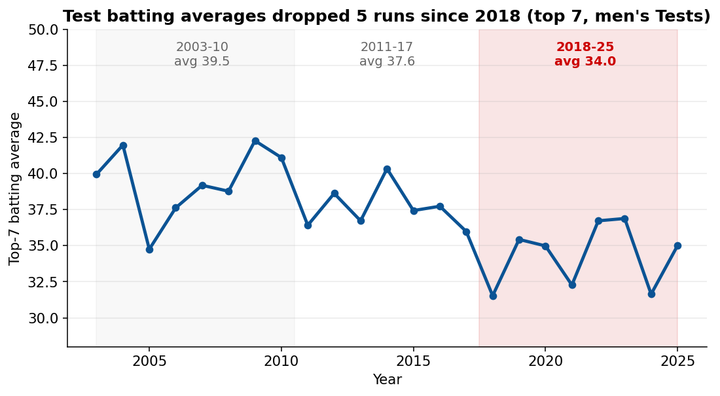
The drop is real

Pooled across all men's Tests, the top 7 averaged 39.5 runs per dismissal in 2003-2010, 37.6 in 2011-2017, and 34.0 in 2018-2025. That's a 5-run drop. More telling: balls faced per dismissal fell from 75.6 to 64.4, a 15% collapse. Batters aren't just scoring less. They're surviving fewer deliveries.
That's the question. Now the bad news for the popular story.
The Dukes ball didn't do it
If the answer were the ball, the drop should be biggest where the ball is most aggressive. Dukes balls (England, Ireland) seam more and last longer than Kookaburras (everywhere else except India), which is why every English commentator with a podcast has been blaming Dukes for the world's batting woes.
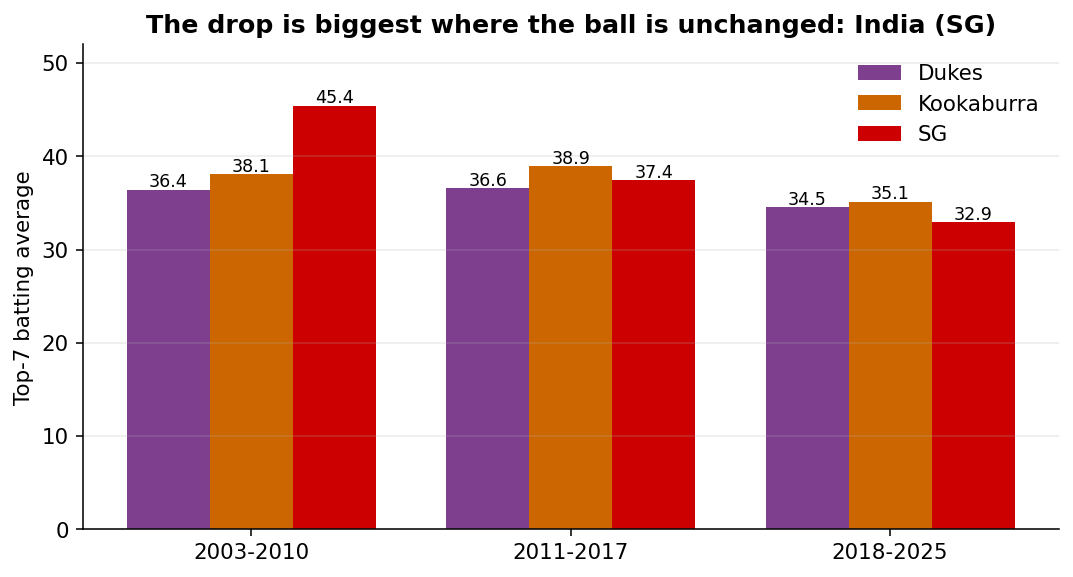
The Dukes regime barely moved. Top-7 average in England went from 36.4 to 34.6, a 5% drop, the smallest of any region. The Kookaburra regime dropped 8%. The SG ball - India's ball, unchanged in design for decades - saw averages fall from 45.4 to 32.9. A 28% collapse. The biggest drop happened where the ball is the least relevant variable. Whatever is going on, it isn't seam manufacturing.
In India, touring batters got demolished. Home batters didn't.
This is where the story sharpens.
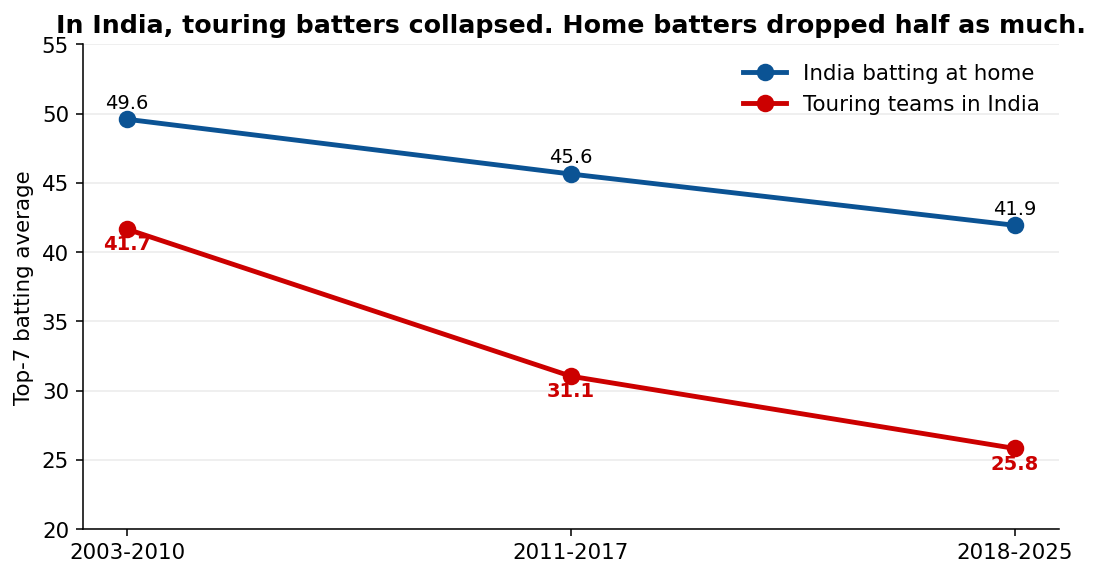
In Tests hosted by India, the home batters' average fell from 49.6 to 41.9 — a real drop, but in line with the global trend.
Touring teams in India in 2018-2025 averaged 25.8 runs per dismissal, on 51 balls per innings.
That's not a Test batter. That's a tail-ender. Touring sides went from 41.7 in 2003-2010 to 25.8 today: a 38% collapse. India's own batters dropped about half as much in absolute terms.
If T20 were the cause, the effect would be roughly symmetric. T20 leagues exist on both sides of the dressing room. Both teams in an India Test face the same pitch with bats also shaped by the IPL. But the data shows a brutally asymmetric collapse: visitors fell off a cliff while hosts merely stepped down a stair. That asymmetry isn't a technique story. It's an adaptation story. And adaptation tells you the conditions changed.
The smoking gun: pitches don't last anymore
Look at the same Indian pitches across the four innings of a Test:
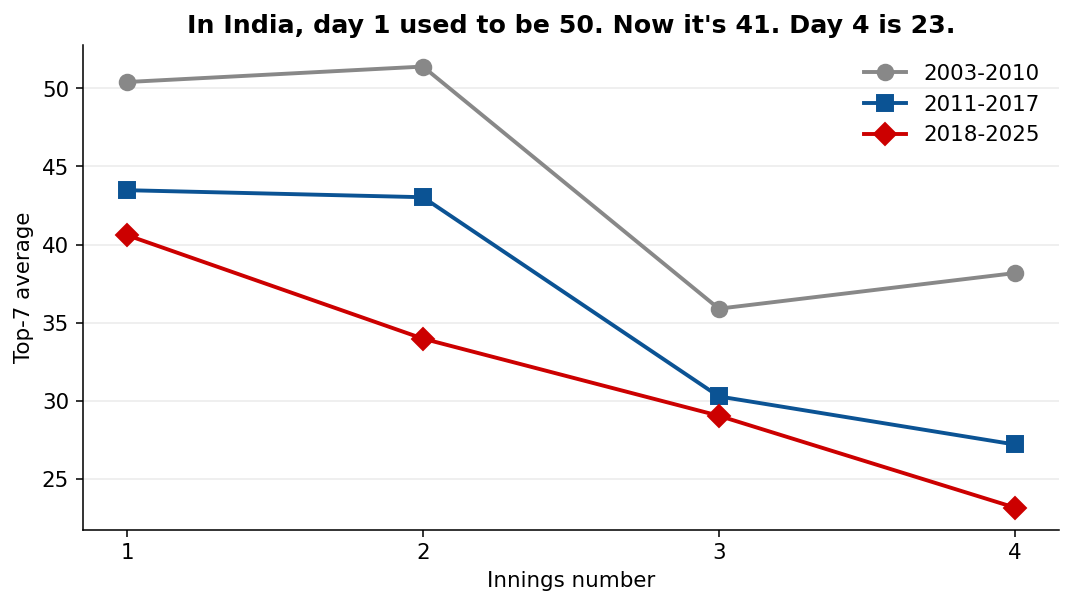
In 2003-2010, day 1 in India was a feast: top-7 average 50.4 in the first innings. By day 4, it dropped to 38.2. Pitches got worse, but you got most of a Test before they did.
In 2018-2025, day 1 averages 40.6 — barely better than England's 4th innings used to be. Day 4 averages 23.2. Balls per dismissal in the 4th innings: 44. Sub-50 strike rates couldn't save you because you'd be back in the pavilion before the strike rate stabilized.
Indian pitches now degrade from ball one. The day-1 flat track / day-4 nightmare pattern collapsed into day-1 nightmare / day-4 catastrophe.
This is what aggressive pitch curation looks like in the data. It's not subtle. And it's a deliberate choice.
The boards got what they paid for
If you're going to argue that boards engineered this, you need a motive. Here's the motive:
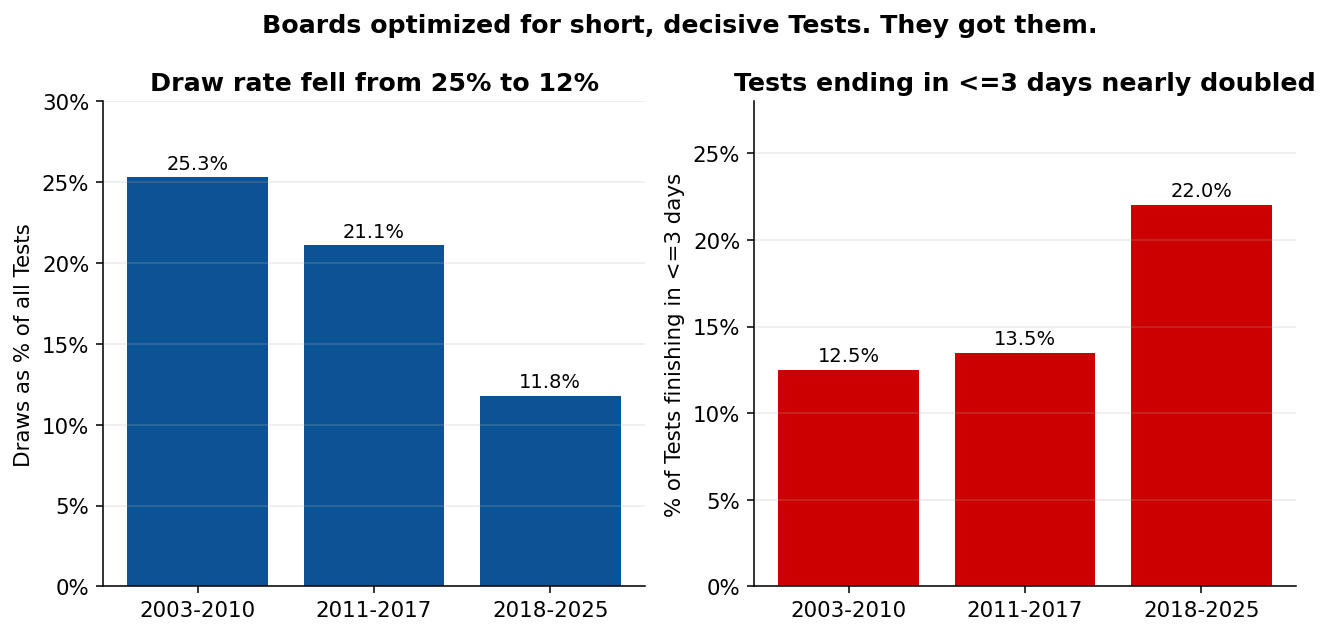
Globally, the draw rate in Tests fell from 25.3% in 2003-2010 to 11.8% in 2018-2025. The share of Tests finishing in three days or fewer doubled, from 12.5% to 22.0%. In India alone, the draw rate fell from 43.3% to 6.1%, and 48.5% of India-hosted Tests now finish in three days. Average match duration in India went from 4.7 days to 3.8 days.
Boards optimize for short decisive Tests because short decisive Tests sell broadcast inventory and ticket-holders show up. Five-day grinds with day-5 declarations don't. Pitch curation is the lever. Pull it, and you get more results, more upsets, and incidentally, much lower batting averages.
The data, motive and mechanism fit. The signature of "decisive results jumped at the same time averages fell" is precisely what the regulator-induced-volatility hypothesis predicts.
What the data refuses to support
A causal claim is only as good as the alternatives it rules out. Four candidates fail their tests:
T20 ruined batting technique. I split batters into three cohorts by debut year: pre-T20 (debut ≤ 2008), mid (2009-2014), and T20-native (debut ≥ 2015). All in the 2018-2025 era.
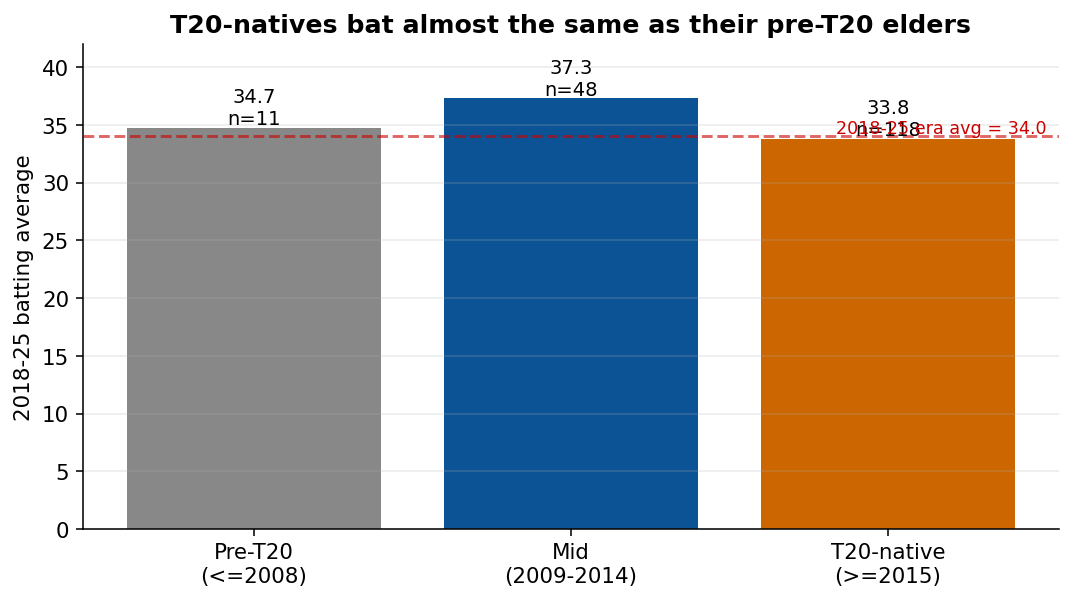
T20-natives average 33.8. The pre-T20 cohort still playing averages 34.7. The mid cohort, which had the most career overlap with T20 but learned the game pre-IPL, averages 37.3. The biggest cohort gap is ~3.5 runs. The era-wide drop is ~5 runs. The touring-in-India drop is ~16 runs. T20 effects exist, but they're a third-order driver, not the lever.
DRS cratered LBW geometry. The dismissal mix barely moved. LBW share went from 17.6% to 16.3%, bowled from 16.1% to 17.1%, caught from 59.6% to 60.9%. If DRS reshaped batting averages by manufacturing LBWs, that mix should look very different. It doesn't.
The COVID saliva ban (March 2020) killed swing maintenance. I compared 18 months before and after. Global top-7 average: 35.0 pre-ban, 33.7 post-ban. Within Dukes, the post-ban window was higher than pre. The ban arrived after the trend, not before it.
Series got shorter, batters got tireder. Within 2018-2025: 1-2 Test series average 34.5; 4+ Test series average 33.3. Essentially flat. Series compression is real and worth its own essay, but it's not the mechanism here.
The DAG that survives
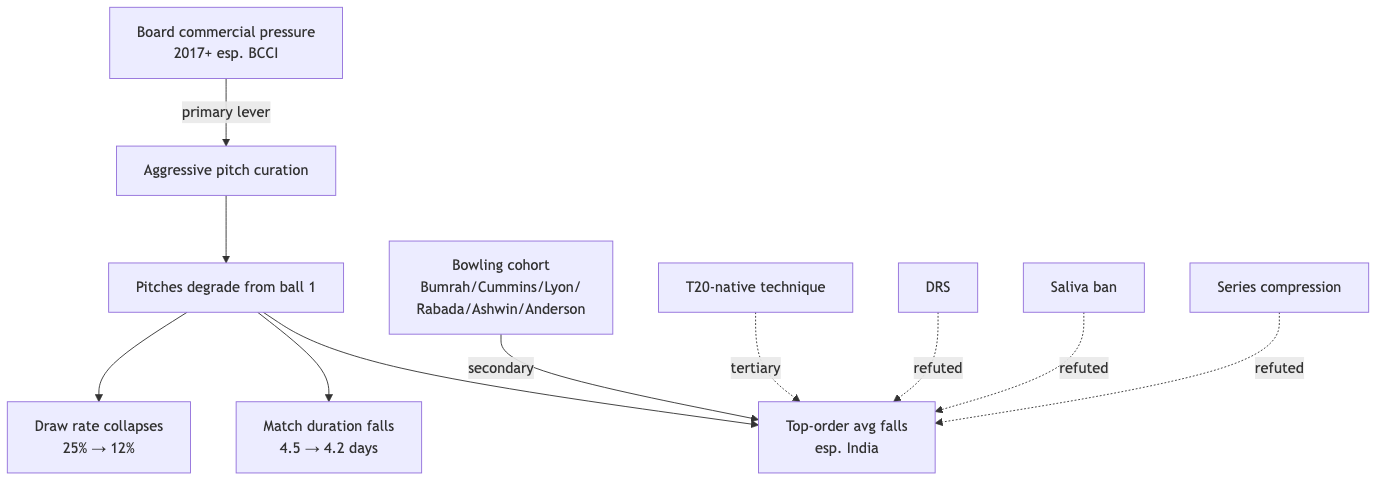
My take: pitch regime is doing 50-60% of the work, the bowling cohort is doing 25-35%, and T20 technique effects are doing 10-20%. The popular story has the order of operations backward.
The bowling cohort is real, just not the headline
Worth flagging: averages against the top-10 bowlers per era went from 35.1 in 2003-2010 to 28.9 in 2018-2025. The current elite-10 (Lyon, Cummins, Starc, Rabada, Bumrah, Ashwin, Broad, Anderson, Southee, Hazlewood) is a defensible "best generation ever." But the gap to non-elite bowlers actually narrowed slightly across eras, which means all bowlers got better, not just the headliners. That's consistent with shared analytics, video study, and pitches that help everyone.
But you can't separate bowler quality from pitch help. A bowling regression on the top-10 in 2018-2025 inherits the pitches they bowled on. The two effects are entangled. What is not entangled is the touring-in-India number: 25.8 against pitches the home team helps prepare. There's no version of "bowlers got better" that explains a touring collapse of that magnitude. That signature is structural.
What this predicts
A causal claim earns its keep by predicting what happens next. Here's what mine predicts, in order of confidence:
- 2026 averages in India will stay near 32. If a draw-rate-targeting board reverses pitch policy, you'll see hosts and tourers re-converge.
- England's Dukes-ball Tests will keep averaging ~34-35 absent a manufacturing change. The Dukes panic is overblown.
- The next country to follow BCCI's revenue model will see the same signature. Watch West Indies and Bangladesh: short series, decisive results, falling top-order averages.
- A T20 retirement effect won't show up. When the current T20-native cohort retires, the next one's Test averages will be approximately the same. Technique isn't where the leak is.
The honest caveat
This analysis uses public Cricsheet data. I don't have ICC pitch ratings, ball-tracking aggregates, or the BCCI's pitch-prep documents. The pitch-curation thesis is the best fit to the data I have, but it's the residual after killing four other hypotheses, not a direct measurement. If someone has Hawk-Eye seam-movement data per match, they can promote my hypothesis to a measurement. Until then, treat it as: "the only mechanism left standing after the obvious ones get refuted."
The popular story isn't a little wrong. It's wrong in the direction that lets fans blame players instead of administrators. That's almost always the wrong place to look first.
Data: Cricsheet (10.9M deliveries, all men's Tests 2003-2025). Top-7 defined as the first seven batters to face a ball in each innings. Run order, bug reports, and the ridiculous number of edge cases I had to handle for non-strikers welcome.